Short answer: two columns confuse almost everyone. “Production Sale per min.” is not a price — it is output per minute divided by stack size, times stack selling value. And “Cohesion Value” is close to a flat 30% of a resource’s stack selling value, so it is not an independent design lever you can shop around for.
Both of those check out against all 68 sellable resources, not one example. Definitions and the working are below.
The glossary
| Term | Where you see it | What it means |
|---|---|---|
| Cohesion | Its own system | The only loss condition in the game. If it hits zero, the run ends. Moved by Events and Pirate Satisfaction. |
| Cohesion Value | Resource tables | A per-resource number contributing to Cohesion. Tracks stack selling value at roughly 0.3x (see below). |
| Stack Size | Resource tables | How many units make one stack. Selling prices are quoted per stack, not per unit. |
| Stack Selling Value | Resource tables | Coins for one full stack. Divide by Stack Size for the per-unit price. |
| Ingredients per min. | Resource tables | Continuous input consumption while the building runs, not a one-off recipe cost. |
| Production per min. | Resource tables | Continuous output. There is no published cycle time, so this is the only rate you get. |
| Production Sale per min. | Resource tables | A derived column: coin value of one minute of output. Formula below. |
| Upkeep per min. | Pirates table | Continuous cost of keeping one worker of that rank. Charged forever, not at hire time. |
| Dedicated Workers | Building tables | Staff slots the building needs. Community buildings count Builders; production buildings count Greenhands. |
| Supplies | Ship stat table | A per-hull number rising with tier, from 20 on the Landlubber to 104 on the Wraith. The wiki does not define what it is consumed by. |
| base / max crew stats | Ship stat table | Two columns per combat stat. The max-crew figure is what the hull reaches fully crewed - usually double the base. |
| Tier (Compass) | Compass table | A rank on one of four progression paths. Thresholds are identical on all four: 0, 3, 7, 12, 20 points. |
| Booster / Building / Ship | Compass table | The three unlock kinds. Boosters have up to 5 ranks; Buildings and Ships have exactly 1. |
| Raid Resource | Resource categories | Six items - Lens, Grain, Tobacco, Silver, Whale Blubber, Wine - with no production building at all. |
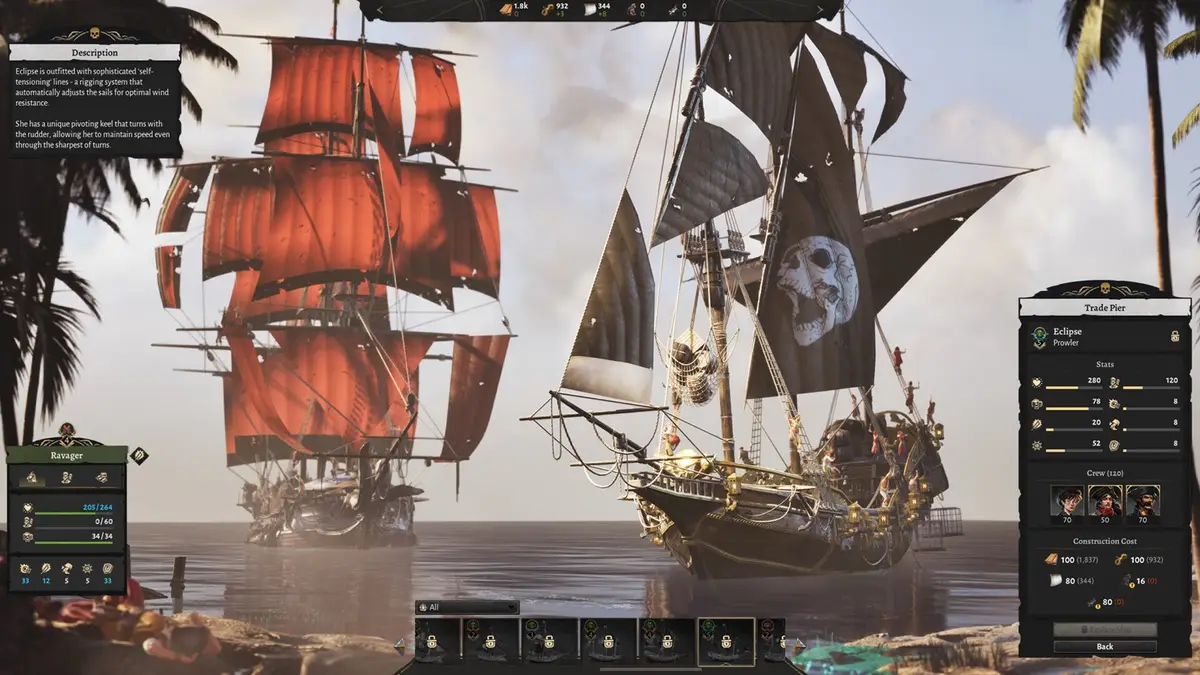
| Prowler / Destroyer / Hunter / Reaver | Ship types | Manoeuvrability, Speed… see the split below. |
Formula 1: Production Sale per min.
Production Sale per min. = (Production per min. / Stack Size) x Stack Selling ValueCheck it on Pitch: 12 per minute, stack of 100, 25 Coins per stack. 12 / 100 x 25 = 3.0, which is exactly the listed figure. Turtle Soup: 15 / 150 x 15 = 1.5, listed as 1.5. It holds throughout.
Why this matters practically: the column rewards high output rate relative to stack size, not expensive-looking goods. Naval Gun sells for 75 a stack but only produces 4 per minute into stacks of 25, giving 12.0 per minute. Tools sell for 60 a stack, produce 8 per minute into stacks of 100, giving 4.8. The revenue ranking is not the price ranking. What that column still ignores is the cost of the inputs you burned to make it — that netting-out is the whole subject of the profit per minute vs. cohesion analysis.
Formula 2: Cohesion Value tracks selling value
Across all 68 resources that carry both numbers, Cohesion Value divided by Stack Selling Value lands between 0.267 and 0.400, clustering hard on 0.30. Boots: 11 / 37 = 0.297. Fittings: 9 / 30 = 0.300. Cassava Bread: 12 / 40 = 0.300. The spread is what you would expect from rounding a 30% figure to whole numbers on small values.
The consequence for planning: you cannot pick a cheap resource that happens to be cohesion-efficient, because there essentially isn’t one. Cohesion per coin is near-constant, so the real decision is volume, not selection. Treat this as an observed regularity in the published data, not a confirmed design rule — the wiki states no formula.
The four ship types in one line each
Each type loads its tier’s headline number into one stat, consistently at every tier:
- Destroyer — Gun Damage (and equal Armour)
- Reaver — Boarding Damage
- Hunter — Speed
- Prowler — Manoeuvrability
A ”+” suffix means a hybrid variant that splits its points across two stats for a higher build price. The tier-by-tier costs are in the ship tier gate table.
Two data artifacts, so you do not chase them
Reading the wiki’s raw tables you will hit two entries that are simply broken, not secrets:
- Shot lists a stack size of 0 and a Production Sale per min. that renders as
-nan. That is a division by zero in the wiki’s own derived column. - Steel Chain appears in the resource table with no ingredients and an output of 0, while the buildings table lists the Chain Smith producing 5 Steel Chain per minute from 4 Steel and 8 Tools. The buildings table is the one that makes sense.
Neither is a mechanic. Where two wiki tables disagree, the buildings table has been the more complete of the two throughout. Cross-checking them is exactly what the production chain dependency matrix does at scale, and the game hub collects the rest of these pages.
Sources
- Corsair Cove Official Wiki, Resources — all column definitions, stack sizes, cohesion and selling values for 77 resources (wiki last edited 2026-08-22, read 2026-08-23)
- Corsair Cove Official Wiki, List of buildings — dedicated worker columns and the Chain Smith recipe (wiki last edited 2026-08-07)
- Corsair Cove Official Wiki, List of ships — Supplies, base and max-crew stat columns (wiki last edited 2026-08-01)
- Corsair Cove Official Wiki, Compass — tier thresholds and unlock kinds (wiki last edited 2026-08-22)
- Corsair Cove Official Wiki, Cohesion — loss-condition wording; no tables published (wiki last edited 2026-08-01)