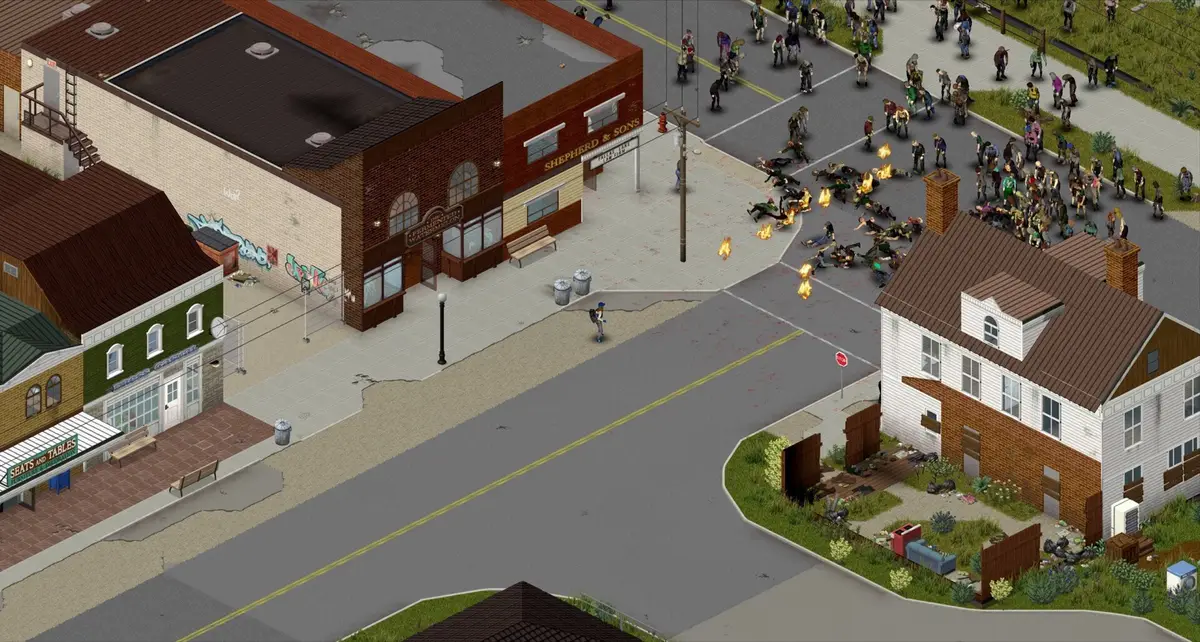
You set Zombie Count to High because you wanted a harder run, nudged Population Peak Multiplier up because 1.5 sounded timid, and left Peak Day alone. The first week felt about right. Then somewhere in the second month the town stopped being clearable and you started wondering whether something in the update broke spawning.
Nothing broke. You set three multipliers that multiply each other, and then handed the product to a ramp that runs for four weeks. The sandbox screen shows you each slider’s own number and never once shows you their product, which is the number your CPU and your character actually meet.
The chain, and the slider that is secretly the same slider
There are four fields involved, and the first thing to get straight is that one of them is a
rename of another. From the game’s own generated SandboxVars comments:
| Field | Min | Max | Default | What it does |
|---|---|---|---|---|
PopulationMultiplier | 0.00 | 4.00 | 1.00 | Set by the Zombie Count population option |
PopulationStartMultiplier | 0.00 | 4.00 | 1.00 | Desired population at the start of the game |
PopulationPeakMultiplier | 0.00 | 4.00 | 1.50 | Desired population on the peak day |
PopulationPeakDay | 1 | 365 | 28 | The day the population reaches its peak |
So “Zombie Count” is not a fourth independent knob sitting above the multipliers — it is
PopulationMultiplier, exposed as a word instead of a number. The word maps to a value:
| Zombie Count preset | PopulationMultiplier |
|---|---|
| Insane | 4.0 |
| Very High | 3.0 |
| High | 2.0 |
| Normal | 1.0 |
| Low | 0.35 |
| None | 0.0 |
You can also type any value in the 0.00–4.00 band directly, so 1.3 or 2.25 are legal settings that no preset name covers.
That leaves the real chain as two multiplications, not four:
effective density on day d  =  PopulationMultiplier  ×  (the ramp value on day d)

ramp value on day 1         =  PopulationStartMultiplier
ramp value on peak day      =  PopulationPeakMultiplier
ramp value after peak day   =  PopulationPeakMultiplier  (it plateaus)
The ceiling nobody prints: every slider stops at 4.00, so the product stops at 16.0, not 4.0. A player who reads “max 4” on each field and sets all of them near the top has asked for sixteen times normal density and has no on-screen indication of it.
What the ramp does between day 1 and the peak day
This is the part where honesty matters more than a clean formula. Two things are documented in the game’s own option text: the start multiplier applies at the start, and the peak multiplier applies on the peak day. What is not stated by the wiki or the option text is the exact shape of the curve between those two points, or the exact day-indexing convention.
The consistent community reading, repeated across Steam discussion threads, is that it climbs gradually day by day and then stops: “there is a ramp up in zombie population each day until the cap is reached”, and once at peak “it wont increase anymore, it is the zombie population cap.” The worked example those threads give — an area with 100 zombies at start holding 150 by day 28 on defaults — is consistent with a straight line, so the tables below assume linear interpolation from day 1 to the peak day. Treat that as a well-supported approximation, not a confirmed internal formula. The endpoints are solid; the middle is an inference, and we are not going to round it into a fact.
One more caveat that matters more than the curve shape: this arithmetic gives you a desired density target per cell, not a headcount. What you meet in the street is also filtered by respawn settings, migration, and the culling limit, so use these numbers to compare configurations against each other rather than to predict a literal number of bodies.
The calculator: six configurations, side by side
Every row is PopulationMultiplier × ramp(d), with the ramp interpolated linearly from day 1 to
the peak day and flat afterwards. The last column is the honest one — how your setup compares to
the Apocalypse default at the same moment.
| Configuration | Count / Start / Peak / Peak Day | Day 1 | Day 14 | Day 28 | Day 30 | Day 90 | Day 90 vs default |
|---|---|---|---|---|---|---|---|
| Apocalypse defaults | 1.0 / 1.0 / 1.5 / 28 | 1.00 | 1.24 | 1.50 | 1.50 | 1.50 | 1.0× |
| “Just bump it to High” | 2.0 / 1.0 / 1.5 / 28 | 2.00 | 2.48 | 3.00 | 3.00 | 3.00 | 2.0× |
| Insane, nothing else touched | 4.0 / 1.0 / 1.5 / 28 | 4.00 | 4.96 | 6.00 | 6.00 | 6.00 | 4.0× |
| Slow-burn outbreak | 1.0 / 0.5 / 2.0 / 90 | 0.50 | 0.72 | 0.96 | 0.99 | 2.00 | 1.33× |
| Flat forever (no ramp) | 1.0 / 1.0 / 1.0 / 1 | 1.00 | 1.00 | 1.00 | 1.00 | 1.00 | 0.67× |
| The stacking trap | 2.0 / 2.0 / 4.0 / 28 | 4.00 | 5.93 | 8.00 | 8.00 | 8.00 | 5.33× |
The bottom row is the one worth staring at. Nothing in it looks extreme in isolation: High zombie count is a normal choice, a start multiplier of 2.0 reads as “a bit busier at the start”, and 4.0 is simply the top of a slider that goes to 4.0. Together they are five and a third times the default density from day 28 onward, and the sandbox screen displays that as three separate, individually reasonable-looking numbers.
The Slow-burn outbreak row is the mirror image and the more interesting build. It is below default density for the entire first month — day 30 sits at 0.99 against the default’s 1.50 — and then keeps climbing to 1.33× default by day 90. That is a world where the early game is survivable on foot and the late game is not, which is closer to what most people mean when they say they want a harder run than “Insane” is.
Run your own four numbers
Pause on the sandbox screen and do this in order:
- Read your Zombie Count and convert it to a number using the preset table above. Call it
P. - Read Start and Peak. Call them
SandK, and read Peak Day asD. - Day 1 density is
P × S. Peak-and-after density isP × K. Those two are exact. - Any day
dbefore the peak isP × (S + (K − S) × (d − 1) ÷ (D − 1)), using the linear assumption flagged above. IfDis 1, skip this — there is no ramp and the answer isP × Kfrom the first morning.
Then divide P × K by 1.5 to get your multiple of the Apocalypse default at steady state. If
that ratio is above about 3, the question stops being about difficulty and starts being about
whether the machine can hold it.
Where this bites in Build 42.20
Two changes in the 42.20 stable release interact with everything above. The patch fixed zombie culling triggering incorrectly and causing population drops — which means configurations that previously felt lighter than they were set may now actually deliver what you typed. And it increased the max limit for the “Zombie count before deletion” sandbox option from 500 to 5000, which raises the ceiling on how much of a high multiplier can be resident at once.
Both of those push in the same direction: a multiplier chain that a server ran comfortably before 42.20 is a heavier load after it. If you are tuning a server and watching frame times rather than survivability, the density product is the first number to bring down, and the server lag settings tracker covers the rest of the knobs that trade fidelity for headroom. 42.20 also reworked crafting menus and skills, not just population — the reverse pottery-station recipe index is the same enumerate-don’t-guess approach applied to what each station can actually make.
This is the same category of mistake as the utilities fields — a sandbox number that means something other than what the screen implies — but the failure mode is different. There, the unit was wrong and 90 meant day four instead of month three. Here every unit is correct and every field means exactly what it says; the problem is that nobody shows you the product. And if you are trying to work out after the fact why a run that felt fine in week one became unwinnable in week five, density drift is one of the quieter entries in the cause finder.
What we could not confirm
Three things, stated plainly rather than smoothed over:
- The interpolation shape between day 1 and the peak day. Linear is the consistent community reading and matches the worked examples people post, but it is not written in the option text or the wiki.
- The day-indexing convention — whether the ramp starts counting from day 0 or day 1. We used day 1. On default settings the difference is under 2% of the ramp on any given day, but it is not zero.
- Whether density decays after the peak day under any configuration. The community answer is a flat plateau and we have found nothing contradicting it, but no official statement says so.
Sources
- Project Zomboid Build 42.20.0 patch notes summary — Patched — the zombie culling fix and the “Zombie count before deletion” limit increase from 500 to 5000
- servertest_SandboxVars.lua with in-game generated comments — GitHub — the min/max/default for all four population fields and the Zombie Count preset-to-multiplier mapping (4.0 Insane, 3.0 Very High, 2.0 High, 1.0 Normal, 0.35 Low, 0.0 None)
- apocalypse_SandboxVars.lua — GitHub — the shipped
ZombieConfigblock confirming PopulationMultiplier 1.0, StartMultiplier 1.0, PeakMultiplier 1.5, PeakDay 28 - “Can someone explain to me Population Multiplier settings in sandbox settings?” — Steam Discussions — the daily ramp-up description, the 100-to-150-by-day-28 worked example, and the statement that population plateaus at peak
- Project Zomboid Server Settings Explained (B42) — WinterNode — Start Multiplier as “population level on day 1”, Peak Multiplier as “population at peak day”, Peak Day default 28
- Project Zomboid Sandbox & Zombie Settings Guide — xgamingserver — the 0.0–4.0 multiplier band and the warning that Population Multiplier compounds with Peak Multiplier